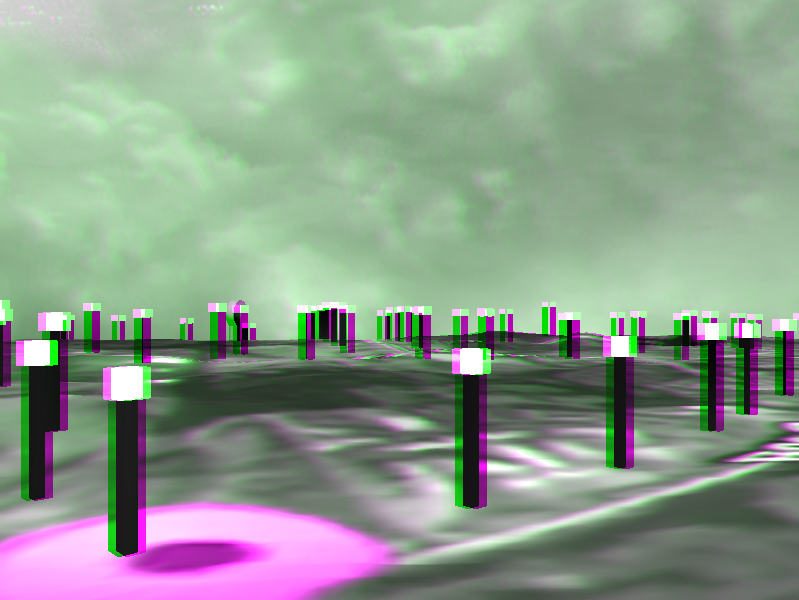
Doing this increases the size of the code substantially. The resulting image looks similar to the error diffusion shader, especially the version where it was clamped and interlaced with the original image. This one does not use the original image. It only uses 8 colours, but the way they are blended makes it appear as though there are more. It looks a bit like a gif. 
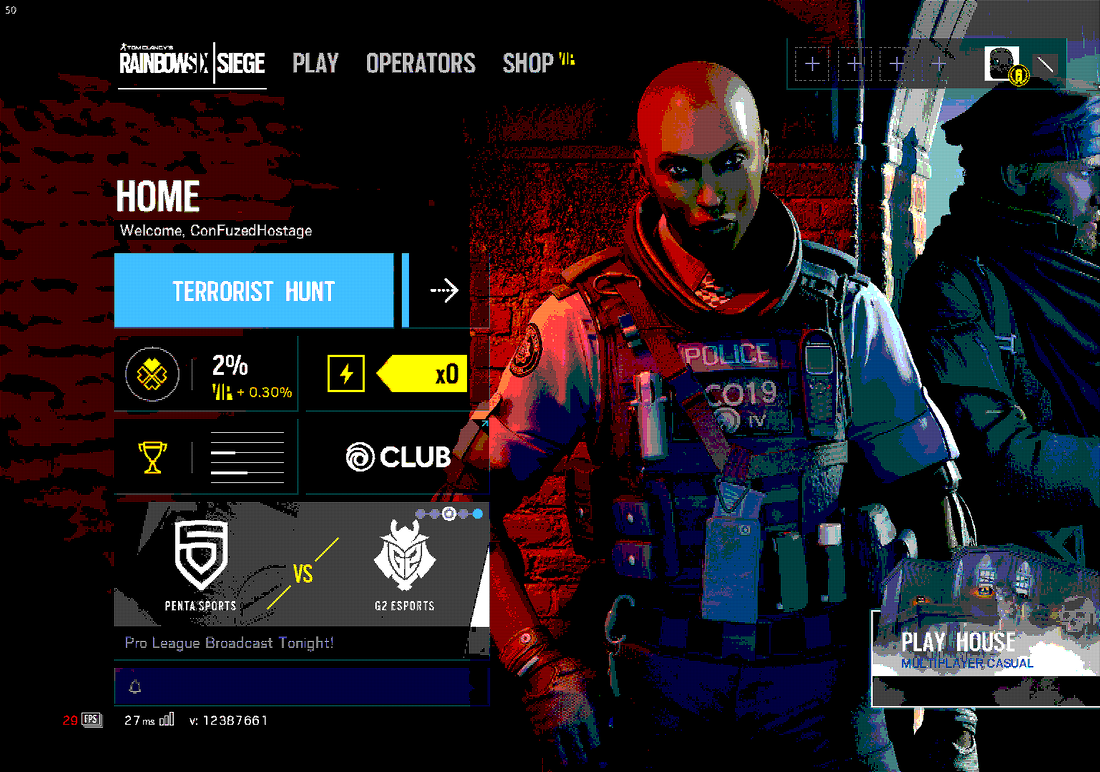
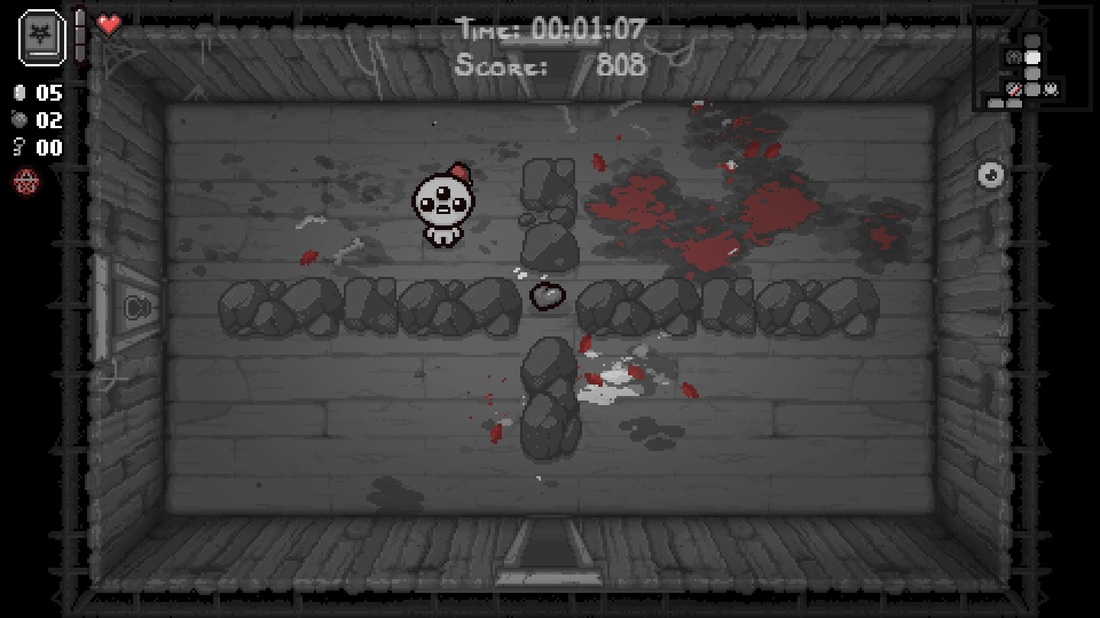
NB: The low frame-rate in the bottom left is because this window isn't in focus, it is not a result of the shader.
0 Comments
I may have said in my last post that it was necessary to use if-statements to achieve the desired effect. That was not really true. If you've read my previous posts, you'll know that you don't need an if-statement to find out whether a number is odd or even. To assign a value to something classified as odd you use "& 1" but we don't want to find the odd pixels (the pixels whose coordinates are odd) we want to find the even ones. A simple fix for this is to find the odd ones and invert the result by doing "1 - ..." This is shown by the following code:
That is used to replace:
At the end of the method we return float3(val, val, val)
So this is the new code:
You may notice that we are using else-if-statements this time. This is because we are not returning in each if. There may be an ever so slight performance improvement if we did a return in each if, but I don't think it's worth it given how concise the code is now.
One thing I do wonder about is whether all the if-statements can be removed. Could it be done by multiplying the value up then doing some clamping? I don't think it's likely, but if it were possible, would you want to complicate the code?
Background
Using a screen-tone is a bit like using tracing paper. They are used by black and white comic book artists (particularly manga artists) to create patterns that look like gradients but are in fact just combinations of black and white (clear) dots. They are used so that the comics are easier to print; they can be likened to the dots seen in pop-art. My screen-tone patterns For this program I use 5 different patterns / screen-tones. They are: Nothing (white), Dots, Horizontal Lines, Intersecting Vertical and Horizontal Lines, and Full Black. They are pictured below:
Creating the patterns in a shader
We need to get the coordinates of each pixel, but that's easy enough. The only way to create these patterns in a shader is to use if-statements, it's unavoidable. They are as follows:
Deciding where to apply each pattern
To determine where to apply each pattern, I check the surrounding 8 pixels of each pixel and itself and calculate its luminosity. I created a couple of helper methods to do this:
I then call those methods like this:
After that I find the average luminosity of those pixels:
After I have that number, I can then split the image into bands. Since there are 5 of them, the bands are: 0.0-0.2, 0.2-0.4, 0.4-0.6, 0.6-0.8, 0.8-1.0
So I write some if statements to find which band the current pixels fit in, and in those, I put the if-statements I wrote for each pattern:
I am only ever returning black or white, just like a traditional screen-tone. But what happens if I don't use the average of 9 pixels and just use the value of the current pixel? The bands that the patterns exist in become too small, so the patterns are less noticeable. What do I mean by that? The edges that exist between the bands break down and become too speckled, this does give it a sharper look. The following image shows the effect when using the luminosity from each pixel:
This last image shows the effect of using the luminosity from the average of the nearest 9 pixels:
There isn't that much difference, and it is sort of clearer without the average, plus that way is slightly more performant. So it's up to you which one you use! I suppose it depends on the effect you are trying to achieve.
Didn't do too much today, but I did a quick analysis of the performance gains by increasing the local work group size (and thus decreasing the number of work groups). This was on the same program as the last post.
My results are in interesting in that they do not show that much of an increase even when the LWGS is increased exponentially. Perhaps this is a symptom of a bottleneck somewhere in the algorithm.
No more stack-based buffer-overruns!
So, as I mentioned, I was manually setting the number of groups in the kernel to 64 but somehow getting the right answer. Looking back, it shouldn't have worked, but it did. So, to fix it I made some new variables:
This calculates the group size the same way the GPU would.
I then use this value for the size of my array that I'm going to sum on the CPU, and change "groupSize" in the GPU to get_num_groups(0) Guess what! It worked.
This executes in 0.019 seconds. Still 0.003 seconds slower than the fastest CPU implementation, but not bad! Certainly more like what I expected.
I went over my code several times, making many changes. It is now in a state that I am willing to share and talk about.
The very first thing you want to do is set up OpenCL, which means getting an SDK / library from the internet, building it and linking it to your project. There is a good tutorial series on how to do this as well as the other things I cover in this post. I will link it at the end. The first thing you have to do in OpenCL is create a platform (or several), then from that platform you select your device. In my case the device is my GPU but it can be a CPU. Then you can create a context for that device. Next you want to create some code to run on the GPU, this is called the kernel. After that you'll want to generate your program from your kernel against your context. This is not confusing at all. Once you have your program you need to build it. You might have to specify which version of OpenCL you're using in your build arguments, e.g. "-cl-std=CL1.2" But what if it doesn't build correctly because there's a syntax error (or something)? Well, program.build() returns a cl_int which serves as an error code. -11 is the code for an invalid kernel. You can get a list of these codes on the internet, but I'll attach a handy helper function so you won't need to. Well, that's fair enough if you've got a simple kernel. But what if you've got something that's more than one line long? It would be nice to print out the build log to find out which bit it didn't like. Fortunately, there's a way to do that too - I'll include it in my helper file. Context, Device, and Program are particularly useful throughout your program - you can get all kinds of information from them and they are often used in various functions you will need to call. Program is related to the kernel for the most part. Now you will want to generate some buffers to give to the device. There are loads of ways to generate buffers (well, about 3) but what you want to consider when doing so is what flags you're going to set - does the GPU only need to read the data or write it? Do you need a host pointer? Probably not. How much space do you need to give it? Does the buffer need to be populated? Now that you have your buffers you are going to want to find the subroutine in the kernel so that you can pass them as arguments. Another point! Do you want to put these on the heap or the stack, do you want to pass them by reference or by value? You do this by creating a kernel object on the host side, passing the function name as a parameter to the constructor. Once you've got this object you can call kernel.setArg(0, val) where 0 is the index of the argument (1st arg is 0, 2nd is 1 etc.) and val is the buffer you created earlier. If you want to give the device something to work on locally you set that here as well. You give it 3 parameters, the index, the size and the value - a nullptr in my case, this was to store the "local result", more on that later. The next thing to do is create a command queue - this is created from a context and a device and is used to give instructions to the GPU. The first thing I put on the queue is a call to enqueueNDRangeKernel. This sets up the ranges for the amount of memory the GPU has available for the program, and the amount that it is split into. The splits are worked on in work groups, the number of work groups is generated by the compiler by dividing the total size by the chunk size. It is incredibly useful to have both of these numbers divisible by 64, and the big divisible by the small. Each device has a max work group size, mine is 4100 which is suspiciously close to 4096. So there are these things called work groups, and there are these things called work items - these are not items of work to be done, they are workers. The more work items in a work group, the better. For some reason the maximum size I could give as my local (chunk) size was 256. I feel like this requires more investigation but I feel like that's a job for another time. BAM! The GPU is now doing stuff. Cool. Now we want to get some information out of it. We need to add something else to the queue. Something to read data from the buffer we gave it to write to. Again, there are several ways of doing this. I settled on using enqueueMapBuffer() as it is supposedly faster than enqueueReadBuffer(). This returns a void pointer which I memcpy'd the data from into an array of integers. Why an array? I'll explain later. Then after that you need to unmap the buffer with a call to enqueueUnmapMemObject(). Finally once the queue is finished and you've added everything you want to it, you call queue.finish() which waits (apparently) for the operations on the queue to finish executing before continuing on with the rest of the program. Then I add up the contents of my array and print it. I am now done explaining what I do on the host, now to talk about the device. In case you didn't know, the host I keep referring to is the CPU, the device could be a GPU, CPU or APU. As mentioned, it is a GPU in my case. Below is my kernel code:
There are two things I want to mention to begin with: the parameters, and the threads.
Parameter 0 is the data from the image. This is covered in a previous post, but I will reiterate, it's a truncated array of integers, where each item represents one pixel. This is because the un-normalized R,G,B components of the pixel were summed and stored in it. I did this using stb_image. It is truncated so that it is nicely divisible by 64. Next is the local result - this is another array of integers, the one that we only allocated the size for before and not the value. Each work item comes up with its own local result. These are then summed and stored in a group result, i.e. a result for that work group. This is the third parameter, and what we read from in the host. The fourth parameter is the size of the array we're passing in. The reason for this is that it is what I saw in an example and seems safer than trying to work it out from get_global_size(0). NB the parameter here is for the dimension - we are using a 1-dimensional array so it is always 0 (the first dimension) for us. This leads me to my next point - each thread will be going through this code (the same code) and executing its own thing. The get calls return a unique result for each thread e.g. get_num_groups(0). This means that they all work on a different part of the image at the same time. Fortunately, the increment to val is thread safe as each thread has its own copy. What is nice is that we can add them together across threads, you wouldn't be able to do that in OpenGL. "val" is the number of odd numbers for each work item. We have global, group, and local. After finding our local result, we want to make sure all the threads have finished finding theirs so we can add them up into group results correctly. For this we use a barrier. Here is a simplified diagram:
Note that this is extremely not to scale, the number of groups here is a huge understatement to what I used. I set the number of groups to be 64 in the source code - this is the wrong name for it, it would be better off as chunk_size or num_group_results. There are 79,088 groups on the CPU, the local size of each of these is 256 (set in the CPU). This is because ~20M / 256 = 79,088. The image has about 20 million pixels.
num_work_groups = global_size / local_size This is pretty confusing because the number of groups the GPU says I have is a different number to 64. My groups are different to its groups because I get 64 group results out of it. You can print from the GPU in OpenCL if you want to find out your work group size. Pretty nifty IMO (but each thread's going to do it if you're not careful). You do this using printf(). When we do add our group results together, we do it using only one thread for each of them. Anyway, after we've got our array of group results (the six squares on the big one) we get them onto our host and sum them. To check the result, I did the same calculation on the CPU beforehand (as it is so quick). Here is the output from my program: Max work group size is: 4100 Created platform and selected device Built OpenCL kernel Allocated buffers First 20246528 pixels contain 10088883 odd numbers Found kernel subroutine, passing arguments... Starting clock Kernel ranges successfully set - let's go! Successfully read buffer from kernel Queue finished successfully Clock stopped The program took 0.133066s to execute 10088883 odd numbers, 10157645 even numbers. Press any key to continue . . .
Putting the program into Release mode, not printing and not error checking during the timer reduced the time to 0.12995 seconds. Again, this is much slower than the predicted time from OpenGL and much slower than the time taken to compute it on the CPU.
Lastly, I will note that there is a bug with the program. A fast-fail is triggered by a stack-based buffer-overrun. This occurs when I read the buffer. Stepping through the code at run-time causes this error only to occur when main returns. For now I have disabled the check for this issue. At one time, when I allocated 10x more memory for the buffer, I did not get this error. Now though, it occurs whether I do or do not.
|
AuthorHi there, the name's Matthew Jenkinson and I'm currently working at Firesprite. In my spare time I work on programming projects like you see here. Archives
March 2021
CategoriesLinks to each effect in order:
|